Your Budget Variance Report Won’t Fix Your Missed Targets

What CFOs and Controllers Need to See Between the Planning Cycle and the Close
The close-of-books meeting follows a familiar script.
As CFO or Controller, you put together a thorough variance report explaining why the actuals came in short of plan — not disastrously, but enough that your CEO is asking questions. What happened? The labor efficiency line drifted due to machine downtime. A cost center ran over on the admin expenses. The explanations are accurate, but they don’t explain what’s really going on.
The problem with a variance report is that it’s a lagging indicator by design. It tells you what occurred in a period that’s already closed. It confirms the drift. It doesn’t explain where execution broke down, who owned the underperforming initiative, or whether the weekly activity driving each line was ever tracked in the first place.
For CFOs and Controllers running cost initiatives in a rising-cost environment, that lag gets expensive fast.
What Does a Budget Variance Report Actually Tell You?
A favorable or unfavorable variance is a financial fingerprint of execution.
Markets shift, so your assumptions will sometimes be wrong. That’s expected. But when a cost reduction initiative consistently comes in 12–15% short of its monthly target, or when labor efficiency misses three quarters in a row, the variance report confirms something else: the execution system doesn’t track what happens between closes.
Here’s what most variance lines are actually signaling when you look below the surface:
- Labor efficiency variances often trace back to undefined weekly productivity targets. No weekly metric, no visibility into whether the team was on pace until the period was already closed.
- Initiative spend shortfalls typically reflect an ownership problem. The initiative might have been spelled out in the budget, but the responsible party was an entire cost center or department rather than a named individual with a weekly deliverable. By the time the review surfaced the shortfall, an entire quarter was gone.
- Cost center overruns are usually forecasting problems on the surface, but execution problems underneath. Spend discipline at the line level requires checking actuals against targets during the period, not just at month-end.
A variance report captures all of this, but does so four to twelve weeks after the drift started. That timing is a real issue.
Why Do Cost Reduction Initiatives Miss Their Targets?
Cost reduction initiatives are vital to margin contribution in a market like the one we are currently in. But there’s typically a big gap between what’s planned in the budget and what is actually executed.
Here’s what tends to happen as a result:
The initiative gets allocated to a cost center or division. The team is aware of the target. Then the quarter starts, and everyone executes against their day-to-day. There’s no weekly check-in tied to initiative performance. There’s no scoreboard showing whether the initiative is on pace or drifting. The first real signal comes four to eight weeks in, when someone pulls a flash report or the close-of-books data comes through. By then, the drift has already compounded.
When 60% of U.S. businesses report rising operating costs from tariffs and insurance increases above planned levels in 2026, an initiative that drifts for six weeks doesn’t just miss its number — it leaves you holding unplanned cost exposure with a report that confirms what you already suspected.
The fix is visibility between the planning cycle and the close.
The Execution Data Your Variance Report Is Missing
Finance teams have a strong reporting infrastructure. Monthly actuals, rolling forecasts, flash reports, and budget-to-actual by cost center. The data coverage at period-end is usually solid. What’s missing are leading indicators: the in-period activity data that tells you whether a cost initiative is on pace before the variance is locked. Leading indicators for cost execution look like this:
- Weekly spend rate vs. target run rate — Is the cost center tracking toward the monthly number, or are actuals already trending over?
- Initiative progress against weekly milestones — Is the named owner moving the initiative forward? Or has it stalled without surfacing?
- KPI status vs. plan — Are the operational metrics driving cost efficiency moving in the right direction this week, not just this quarter?
Variance reports answer the question: What happened? Leading indicators answer the question: What’s happening right now, and do we need to adjust before it’s too late?
Finance leaders who can answer the second question are the ones who protect quarterly margins. The ones still waiting for the monthly report to answer it are the ones explaining the variance four weeks after the drift started.
Want to know what organizational misalignment is costing your business in hard dollars?
The Misalignment Cost Calculator estimates the financial impact of execution drift — across labor, initiative underperformance, and leadership time — using your own numbers.
Calculate Your Misalignment Cost →
How Can CFOs Build an Execution System That Supports the Financial Plan?
Closing the loop between your financial plan and execution doesn’t require a new budgeting tool, a restructured close process, or additional headcount. It requires an execution system with three components that most growth-stage companies don’t have in place.
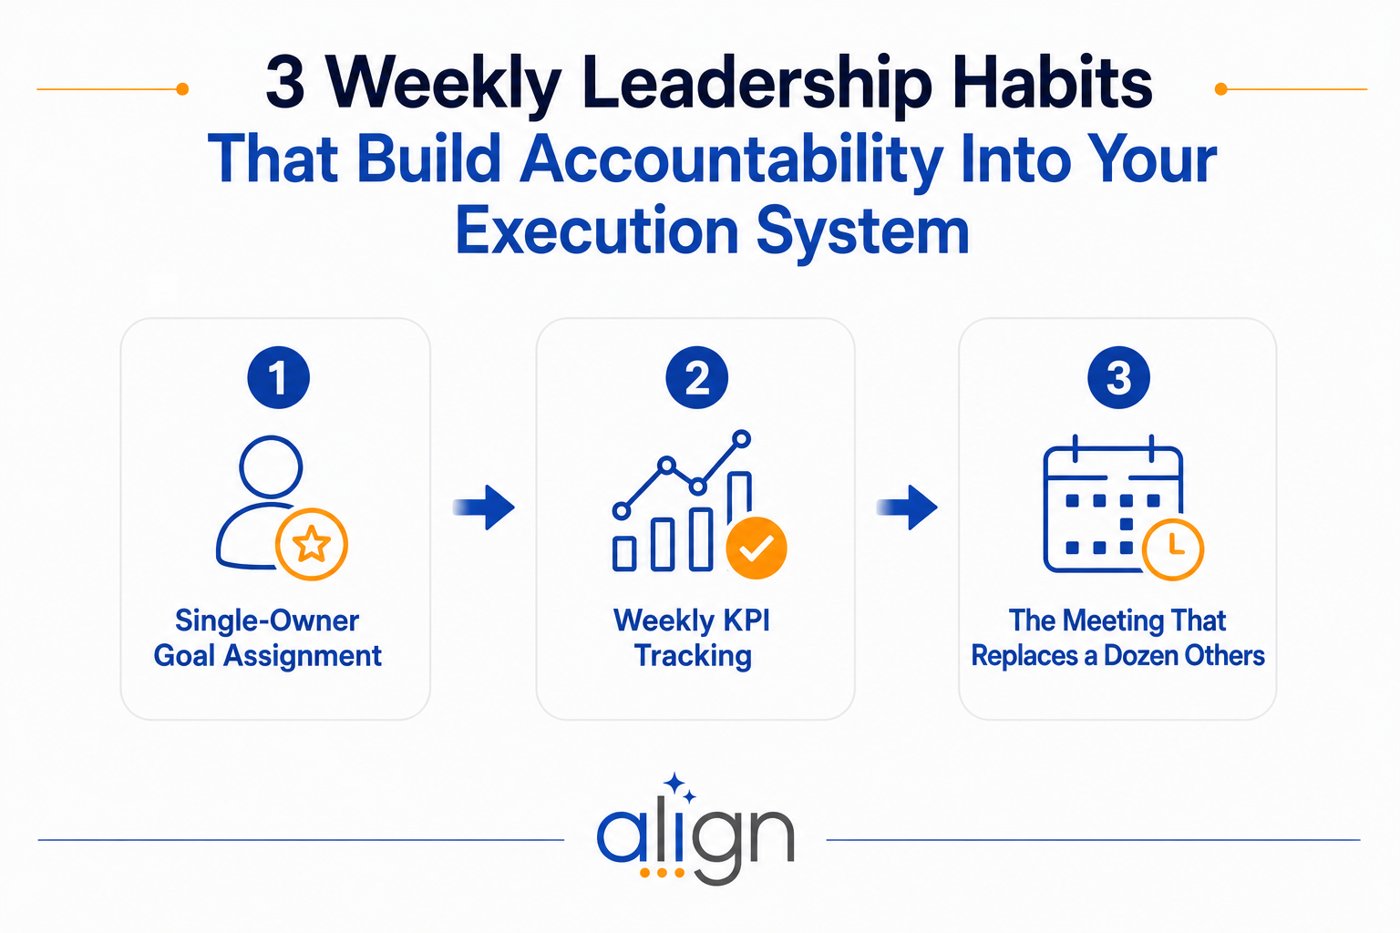
First: Named ownership at the initiative level. Every cost initiative should have a single person accountable — not a department, not a cost center. An individual with a name and a weekly deliverable. Shared accountability diffuses it. When the initiative misses, no one person owns the explanation.
Second: Weekly KPI visibility above the line-item level. The operational metrics driving cost performance — labor hours per output unit, vendor spend rate, headcount productivity — need to be tracked weekly, not just at month-end. Your team should see whether these metrics are green, yellow, or red every week, not when you pull the flash report.
Third: A weekly execution rhythm that connects priorities to financial outcomes. Quarterly goals need to produce weekly behavior. If the cost initiative is a strategic priority, it should appear in weekly leadership meetings as an item with a status update, not just on the variance report as a line item that came in short. This is where cost strategy lives — in the execution system, not the budget spreadsheet.
When all three are in place, your variance report changes. There is less need for explanation because you already knew the initiative was drifting three weeks before the books closed, and you adjusted.
That’s the difference between a team that reports what happened and one that protects what was planned.
What Your Next Close Can Look Like
The close-of-books meeting happens every four weeks. For CFOs and Controllers, the path to cleaner closes with less variation runs directly through execution visibility.
Not more sophisticated reporting.
Not a better BI tool.
A system where cost initiative ownership is visible, weekly KPIs surface the right signals, and leadership teams can see in-period drift before it becomes a variance.
Your next close can look different. Start with understanding what the current drift is costing you.
Want to know what organizational misalignment is costing your business in hard dollars?
The Misalignment Cost Calculator estimates the financial impact of execution drift — across labor, initiative underperformance, and leadership time — using your own numbers.
Calculate Your Misalignment Cost →