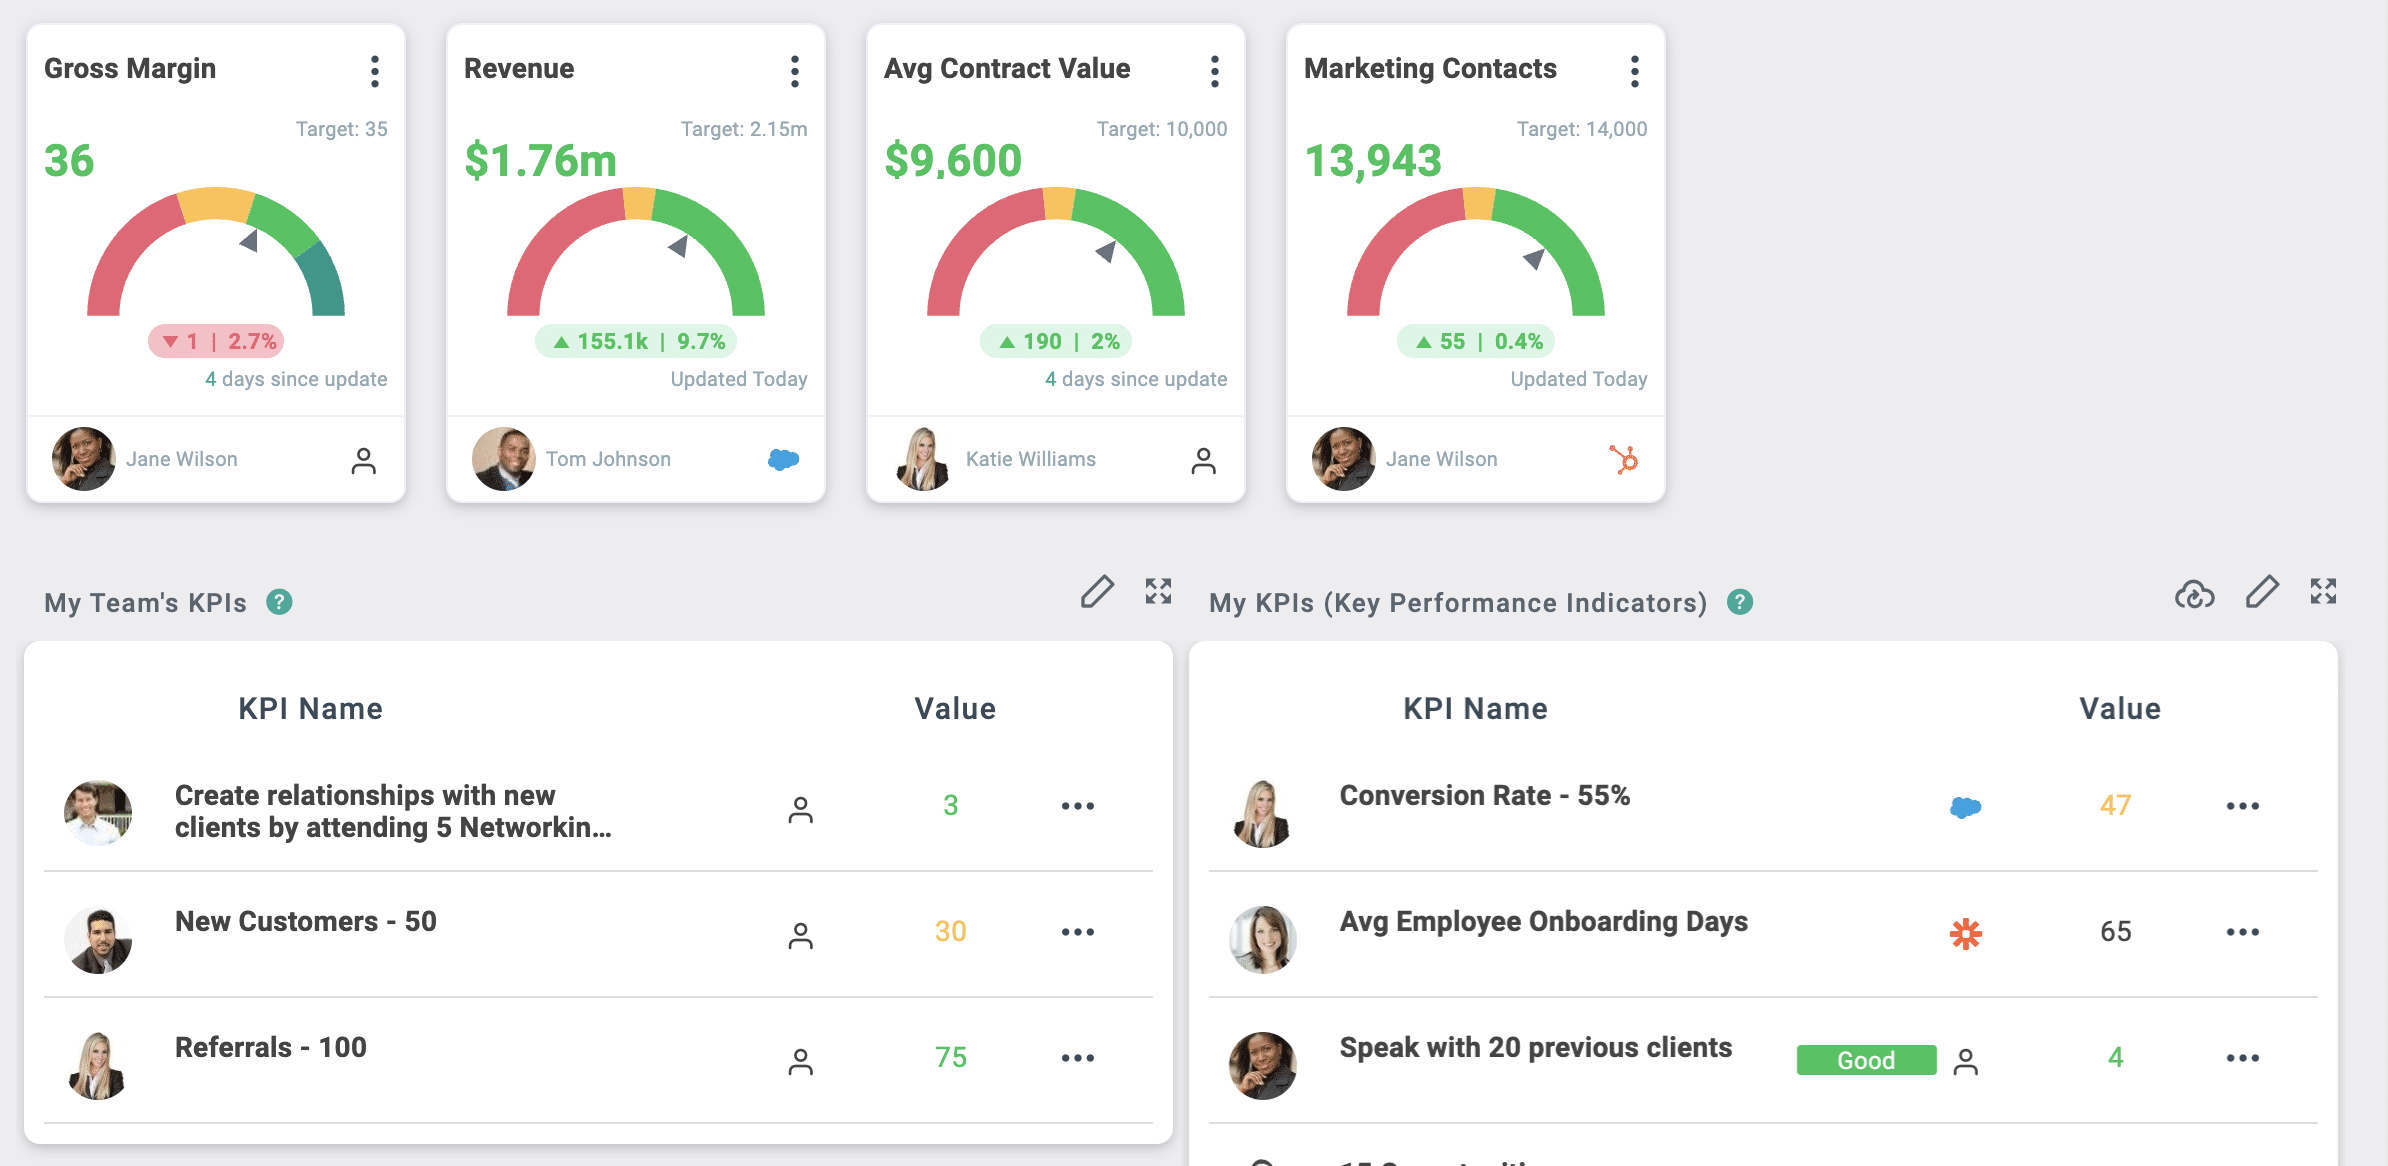
KPI Cards
KPI Cards are Visuals
Think of KPI cards as the visualization of other items in the software. Use this feature to reinforce data driven decisions, align your team around specific numbers
What is the difference between Metrics, Priorities, Critical Numbers, and KPI Cards?
Metrics are the connection point between all of the visualizations in the software. To use an integration, you connect it with a Metric. To update the same number in multiple places, connect it with a metric!
KPI Cards are visualizations of other items in the software. You can visualize any of the measurements from Quarterly Actions on the One Page Plan to your Priorities and Critical Numbers or even a standalone metric (Preview Release!).
Priorities can be number driven which means you can measure the priority with a number. That number can be a standalone that is only on the priority and not connected. Or it can be a metric that is able to connect to other components or integrations.
Critical Numbers are the 5 numbers that are elevated to a higher status. These numbers are often leading indicators of success for your team. The numbers you want your team obsessing over and rallying behind this quarter.

Get Started with KPI Cards
KPIs (Key Performance Indicators) are an integral part in visualizing the important numbers you are tracking.
Our KPI Dashboard feature in the My Dashboard, Company Dashboard, and within Huddles is a quick and easy way to organize the key figures you or your team are tracking so you can get a quick overview of your goal progress and health at a glance!
How should I put these to work for me and my team?
Here are a few examples of how Sales Leaders, Team Leaders, and C-Suite Executives may use KPIs. We’d love to hear your favorite use case! Email advisor@aligntoday.com to share your feedback.

For step-by-step directions and a video on how to add KPI Cards to your dashboards and huddles, check out this page in the in-app FAQs!
Did you know…
-
You can have MULTIPLE KPI groups on the My and Company Dashboard and in each of your huddles? Just add the component multiple times! It’s a best practice to re-name the KPI Dashboards so your data stays organized.
-
On your dashboards, you can have a minimized view as well as the expanded view? Use them to add interest to your dashboards.
Add Targets to your metric driven KPI Card
*This is a Preview Release Feature
Is this different from the numbers I currently measure?
Yes! Right now, you measure and visualize your “ON” the business numbers – Critical Numbers, Quarterly Targets, and Priorities. Use Metrics with Targets to enjoy the same visualization with “IN” the business numbers by adding KPI components and targets to Dashboards and Huddles.
How will your team use Metric KPI Targets?
-
You can already create Metrics in the software, now you can visualize them!
-
Set Targets to track progress
-
Give context to metrics – is this number good or bad? Am I on track or do I need help?
-
Get visual cues to draw your attention to Metrics that are falling behind or celebrate the wins!
-
Integrate these metrics to get real-time updates with no user interaction – no more “forgot to update” excuses.
What kind of targets can I add?
Custom Targets: These are ideal for maintaining specific figures at a constant point while continuously monitoring them. Think of metrics like your churn rate or win rate, which need consistent attention.
Time-Based Targets: When you have goals with a specific time frame in mind, like reaching $500,000 in new ARR for the period, Time-Based Targets become your best ally. They dynamically change your targets as time progresses, ensuring you remain on track to meet your objectives.
Targets with a Weekly or Monthly Cadence: Tracking metrics on a weekly or monthly cadence breaks down the goal even more than the traditional time-based target. Goals like number of calls per week or monthly revenue targets can be used with a cadence that resets to your chosen number at the end of the week or month.
None: There are metrics you may want to track without setting specific targets for them. These metrics are typically used for monitoring and providing context rather than driving immediate change. Such as your company’s eNPs score.
Who is going to benefit most from this?
-
C-Suite and Leadership – No more asking for updates on numbers from each team – Add those numbers to your dashboard and you can see them whenever you want.
-
Sales Teams – Add multiple KPI components in your Sales Weekly huddle to quickly see who is behind and needs some coaching – get out of the spreadsheets and into huddles to focus on the actions driven by the numbers.
-
Product Team – Keep track of “in” the business stats that help show the company your progress – metrics like story points delivered or tickets closed in the backlog can help non-tech members of your company know just how much you get done each day or week!
-
Managers – Are you working on scorecards for your team? Each person on your team has KPIs they are responsible to achieve – these “in” the business numbers should be reviewed on 1:1s and addressed early if not progressing as expected. Adding visuals to your KPI cards in your 1:1 huddles points out what numbers need additional focus and which numbers you can celebrate!
AI Driven KPI Suggestions
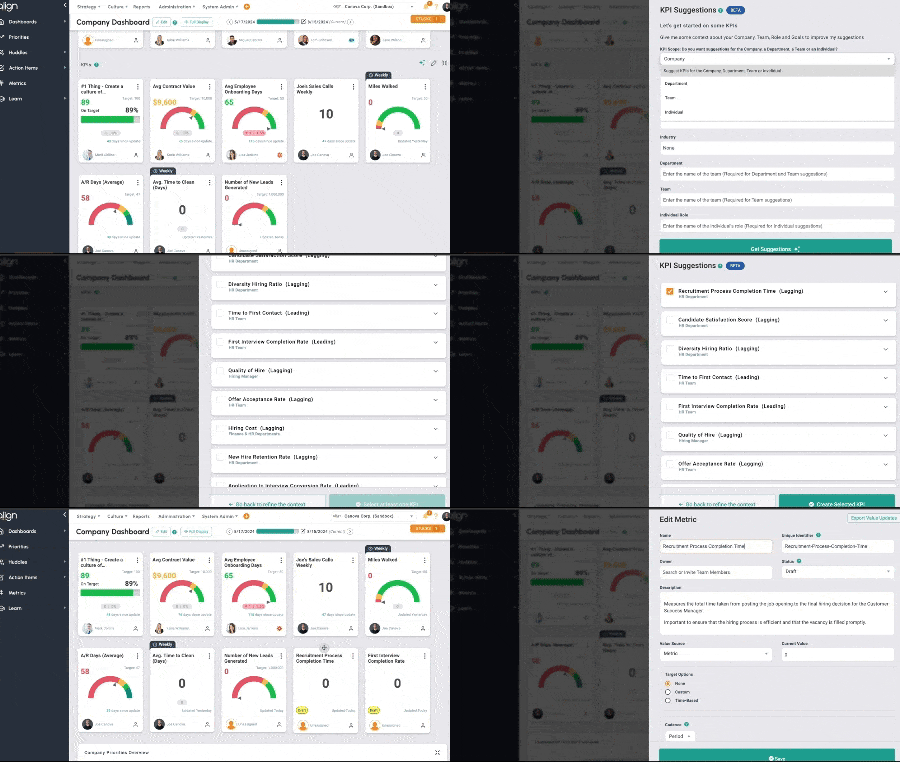
We’ve introduced AI-Driven KPI Suggestions to help you stay ahead by identifying the leading indicators that drive your success.
You may have noticed the 3 stars icon on your dashboard or in huddles. It’s also visible on the Priorities AI Coach when you create a new priority. This icon indicates when a feature is AI-enabled.
Here’s how it works:
- Click the 3 stars to open the KPI Suggester.
- Answer the prompt questions with as much detail as you can. The more information you feed the prompts, the more tailored your results.
- Choose the KPIs you want to create. The system will create your Metric and KPI Cards for you!
Keep in Mind:
- Once you create new KPIs, they will be in “Draft” status. This reminds you to customize them with your company’s specific numbers and targets.
- You can see all “draft” metrics by filtering on the metrics page.
Start using these AI-driven insights to take proactive steps throughout the quarter, ensuring your lagging indicators like revenue and sales closed stay in the green.

