What are Metrics?
Metrics are numbers.
Think of Metrics as the underlying numbers driving your KPIs, Priorities, Critical Numbers and Quarterly actions. Metrics are the connection point for number integrations.
What is the difference between Metrics, Priorities, Critical Numbers, and KPIs?
Metrics are the connection point between all of the visualizations in the software. To use an integration, you connect it with a Metric. To update the same number in multiple places, connect it with a metric!
KPI Cards are visualizations of other items in the software. You can visualize any of the measurements from Quarterly Actions on the One Page Plan to your Priorities and Critical Numbers or even a standalone metric.
Priorities can be number driven which means you can measure the priority with a number. That number can be a standalone that is only on the priority and not connected. Or it can be a metric that is able to connect to other components or integrations.
Critical Numbers are the 5 numbers that are elevated to a higher status. These numbers are often leading indicators of success for your team. The numbers you want your team obsessing over and rallying behind this quarter.
Get Started with Metrics
Many areas that can be enhanced by using the Metrics feature!
Enter your update ONE time and update the connected elements!
-
It starts with a Metric – create the metric for the number you wish to measure.
-
Use that metric as measurement for multiple elements (number for your Priority, Critical Number, KPI Card, or Quarterly Target).
-
When that number is updated on one of the connected elements, the others are simultaneously updated!
Metrics are the connection point for all of your number related integrations.
-
Start with an integrated metric – create the metric and connect your integration
-
Use that metric as measurement for any metric driven element (KPI for your Priority, Critical Number, KPI Card, or Quarterly Target).
-
Each time the integration updates that metric, it will also update the element!
Book a Targeted Coaching Session focued on Data Visualization

Number Cadence
The Number Cadence feature allows users to create metrics with a specific cadence of weekly or monthly.
This is great for sales teams who are looking to create a certain number of leads/deals/calls in a week or a marketing team who is tracking visitors per month.
- When creating metrics with a specific cadence of Weekly or Monthly:
- The Reset Value is the starting point number that will be set on the chosen day of the week or the first of the month
- For a Monthly cadence, the value will reset on the first day of each month
Linked Targets
Linked Targets makes it easy to share Metrics with Targets across Dashboards and Huddles.
When adding or editing a Metric with a Target, you’ll see two sections: Metric and Target.
- The Target section shows if a Target is linked to other Cards across Dashboards or Huddles.
Linked Metrics include a change log and connection count to track where the Target is used. You can still create your own Target for any Metric.
Each Metric with a Target has a unique Target owner—you can:
- Use the current Target
- Create your own Target
- Revert to the existing Target
Visual indicators on the KPI Card and in the Target edit drawer show when a Target is linked.
Metric Owner vs. Target Owner
It is common for the Metric Owner and the Target Owner to be the same team member. This only occurs on Metrics with Targets.
The Metric Owner is the person responsible for the status of the Metric and oftentimes is the one updating the Current Value of the Metric.
The Target Owner is the person responsible for the targets that have been set for that Metric on a Dashboard and/or in a Huddle, and is responsible for making sure those targets are being hit.
Although it is common for the Metric Owner and Target Owner to be the same person but that is not always the case. On occasion, someone who is not the Metric Owner will use a Metric owned by someone else on their own Dashboard and/or Huddle to create their own targets and goals for a Metric. This allows for the Metric to be used in multiple places for multiple purposes.
Each Metric with a Target has a unique Target owner. You can:
- Use the current Target
- Create your own Target
- Revert to the existing Target

Formula Driven Metrics
Combine existing metrics to create simple calculations, create ratios, percentages, and more.
Measure your roll up with a weighted KPI
A weighted KPI is a formula that gives specific numbers more or less value. Use the Metrics that drive the individual child priorities and create a weighted average to drive the parent priority! Great for a sales team quota,
Supercharge your sales huddle
Measure conversion, average contract value, average time to close and more right in your huddle!
Create executive critical numbers that drive success
Use common metrics to measure core company KPIs like Revenue per Employee, Cost of Acquisition, Lifetime Value and more.
If you want more of a "walk through", check out the FAQ pages in the software.

Metrics Report
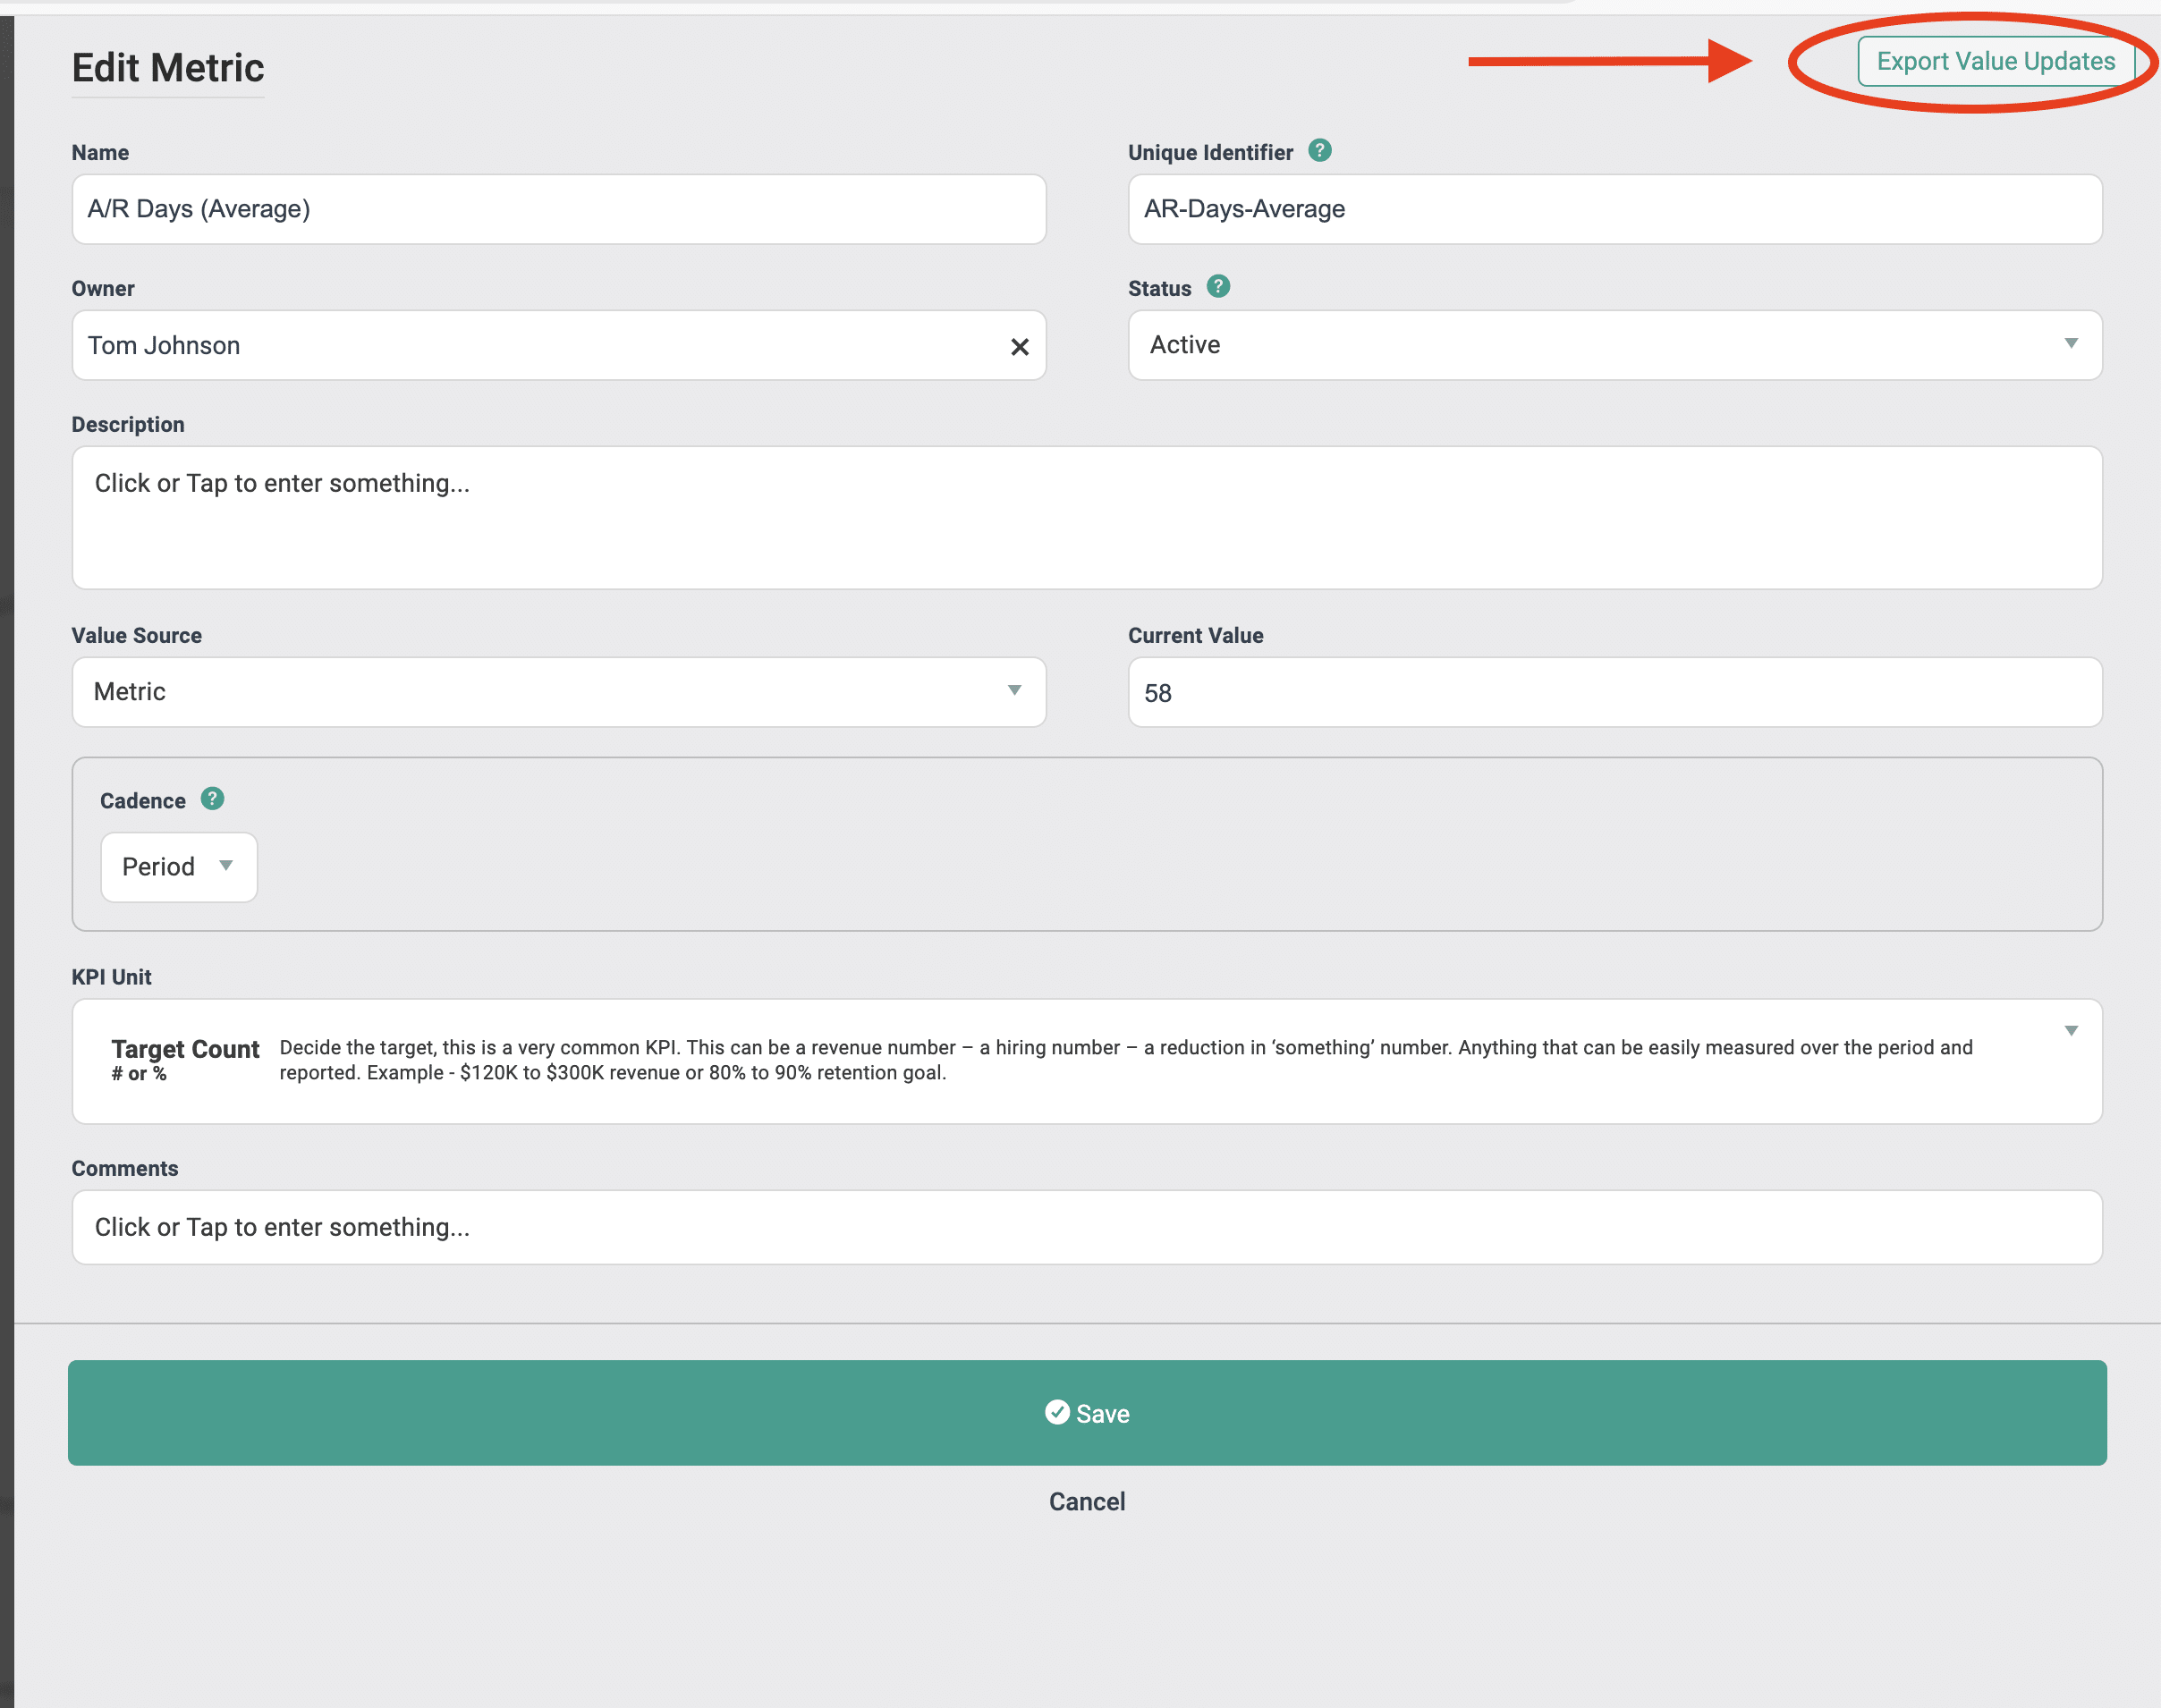
Once you start tracking numbers with Metrics, you can export the entire history of the metric to a CSV.
Take that information and analyze the data over time to see trends.

